Lume V1.2
Installation & O&M
Installation & Operations Manual
Complete guide for site selection, installation, configuration, and ongoing operations & maintenance of the Virridy Lume continuous water quality sensor.
1. Overview
The Virridy Lume is a fully integrated, autonomous water quality sensor that provides continuous, real-time microbial and optical water quality data. It measures tryptophan-like fluorescence (TLF), chlorophyll-a, and fluorescent dissolved organic matter (FDOM) using interchangeable optical configurations—all in a single field-deployable unit with integrated power, data transmission, and cloud connectivity.

Key advantage: The Lume requires no regular calibration, no consumables, and no laboratory processing. Deploy it, connect it, and receive continuous data on your dashboard within minutes.
Intended Applications
- Recreational water quality monitoring (swim beaches, rivers, lakes)
- Drinking water source and distribution monitoring
- Combined sewer overflow (CSO) detection
- Harmful algal bloom (HAB) early warning
- Watershed characterization and dissolved organic tracking
- Wastewater effluent monitoring
- EPA ATP paired-data collection alongside Colilert/Enterolert
2. What’s in the Box
- Lume sensor unit (with optical configuration pre-installed per order)
- Protective sensor cover (hand-twist removable)
- Antenna (internal, external whip, or wire-mount — per order)
- Charging cable (USB-C)
- Mounting hardware (stainless steel bracket + cable ties)
- Quick-start card with unit barcode ID
Barcode ID: Each Lume unit has a unique barcode identifier (e.g., 50030) printed on the unit and the quick-start card. You will need this to access your data on the dashboard.
3. Specifications
| Sensor type | Fluorimetric (SiPM detector + LED excitation) |
| Measurement modes | TLF (microbial), Chlorophyll-a (algal), FDOM (dissolved organics) — interchangeable optics |
| Additional sensors | Turbidity (TOF/SPAD), temperature, GPS |
| Battery life | Up to 1 year (hourly sampling, 24-hour reporting interval) |
| Charging | USB-C (solar or wall power) |
| Sampling interval | 30 seconds to 24 hours (remotely configurable) |
| Reporting interval | 5 minutes to several days (remotely configurable) |
| Connectivity | Cellular (primary) or satellite (remote areas) |
| Data platform | Secure cloud dashboard with API access |
| Calibration | No regular calibration required |
| Cleaning | Tool-free: hand-twist removable sensor cover |
| Deployment duration | Weeks to months, autonomous |
| Housing | IP-rated waterproof enclosure |
4. Measurement Modes
The Lume supports three interchangeable optical configurations. Each unit ships with one configuration pre-installed. Optics can be swapped in the field.
Lume TLF
Ex 280 nm / Em 350 nm
Measures: Tryptophan-like fluorescence—a proxy for E. coli and fecal contamination.
Use cases: Recreational water, drinking water, CSO detection, NPDES monitoring.
Output: TLF (ppb), E. coli probability, categorical risk level.
Lume Cl-A
Ex 470 nm / Em 680 nm
Measures: Chlorophyll-a fluorescence—indicator of algal biomass.
Use cases: HAB early warning, reservoir monitoring, intake water protection.
Output: Chlorophyll-a concentration (ppb).
Lume FDOM
Ex 365 nm / Em 480 nm
Measures: Fluorescent dissolved organic matter.
Use cases: DOC tracking, nutrient loading, watershed characterization, treatment process monitoring.
Output: FDOM concentration (ppb).
All modes also report: Temperature (°C), turbidity (kcps/SPAD), battery voltage (V), and GPS coordinates with every reading.
5. Site Selection
Requirements
- Water contact: The sensor window must be submerged in the water body. Minimum depth: 15 cm (6 in) above the optical window.
- Flow: Moderate flow preferred. Avoid stagnant pools or extreme turbulence that may trap debris on the sensor window.
- Cellular coverage: Confirm cellular signal at the deployment site. If coverage is limited, use the satellite antenna option.
- Security: Deploy in locations where the unit is not easily visible or accessible to the public, or use tamper-resistant mounting.
- Access: Ensure the site is accessible for periodic maintenance visits (typically monthly).
Deployment Environments
| Environment | Mounting | Notes |
|---|---|---|
| River / stream | Bracket on bridge pier, bank stake, or rebar | Orient sensor window facing downstream to reduce debris accumulation |
| Lake / reservoir | Dock mount or buoy | Deploy at representative depth; avoid surface film zone |
| Beach / swim area | Pier or jetty mount, submerged stake | Deploy near the swimming area at typical wading depth |
| Pipe / conduit | Insertion fitting or bypass chamber | Ensure sensor window is fully submerged in flow |
| Well / borehole | Suspension cable | Deploy below the water table; confirm unit fits bore diameter |
Avoid: Do not deploy where the sensor will be exposed to direct sunlight on the optical window for extended periods. UV exposure does not damage the unit but can cause biofouling on the window surface, increasing cleaning frequency.
Array Deployments
For multi-sensor deployments, develop a joint siting plan to bracket potential contamination sources. Position sensors upstream and downstream of suspected inputs. Siting can be optimized over time as contamination patterns emerge from the data.
6. Installation
Hardware Configurations
The Lume supports multiple mounting and installation configurations depending on the deployment environment. Below are examples of common setups.
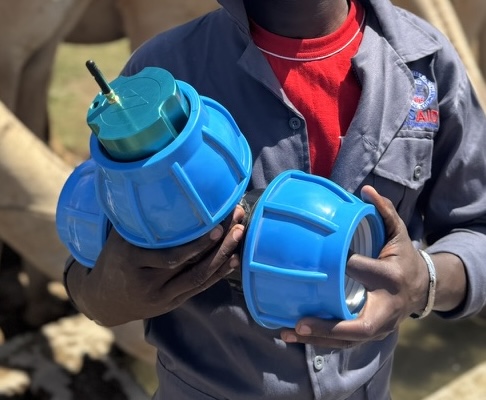
Piped / Tap InstallationLume mounted via compression fitting on a piped water supply. The sensor window faces into the flow path for continuous inline monitoring of treated or source water.
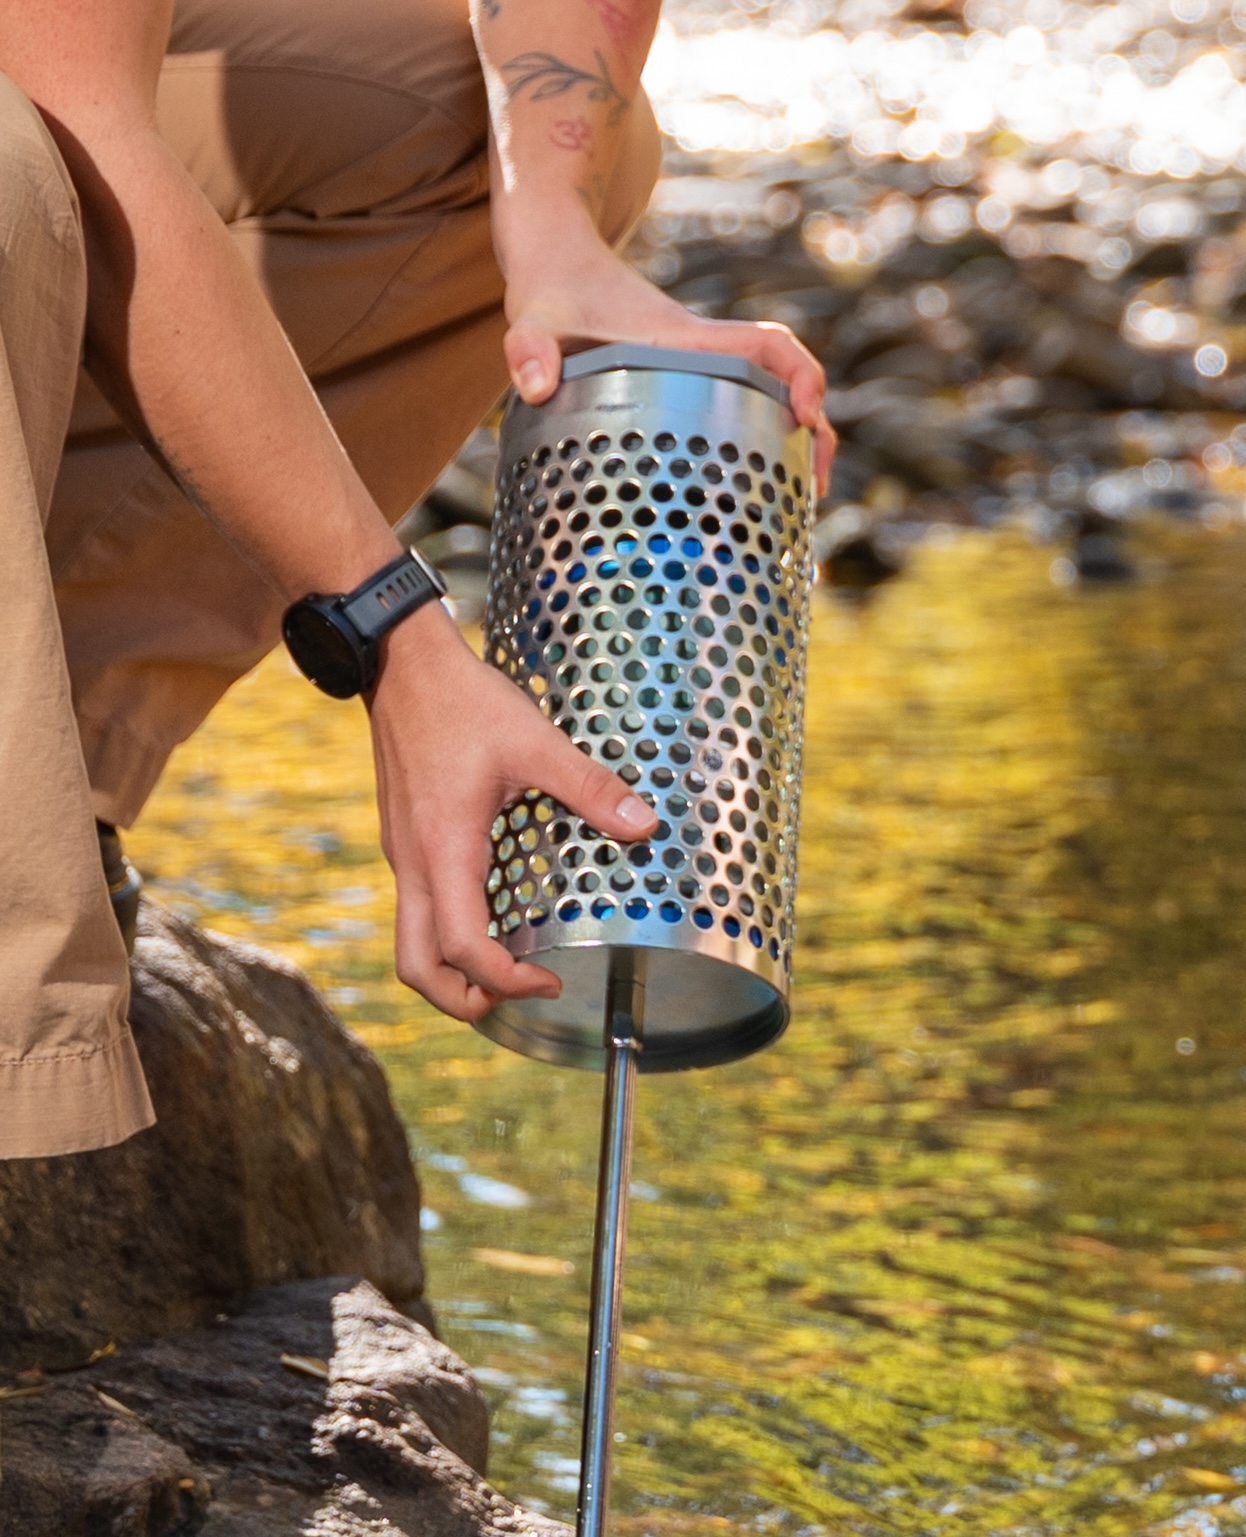
Protective Cage (Open Water)Stainless steel perforated cage with eye bolt for suspension in rivers, streams, or wells. Protects the sensor from debris and impacts while allowing free water flow across the optical window.
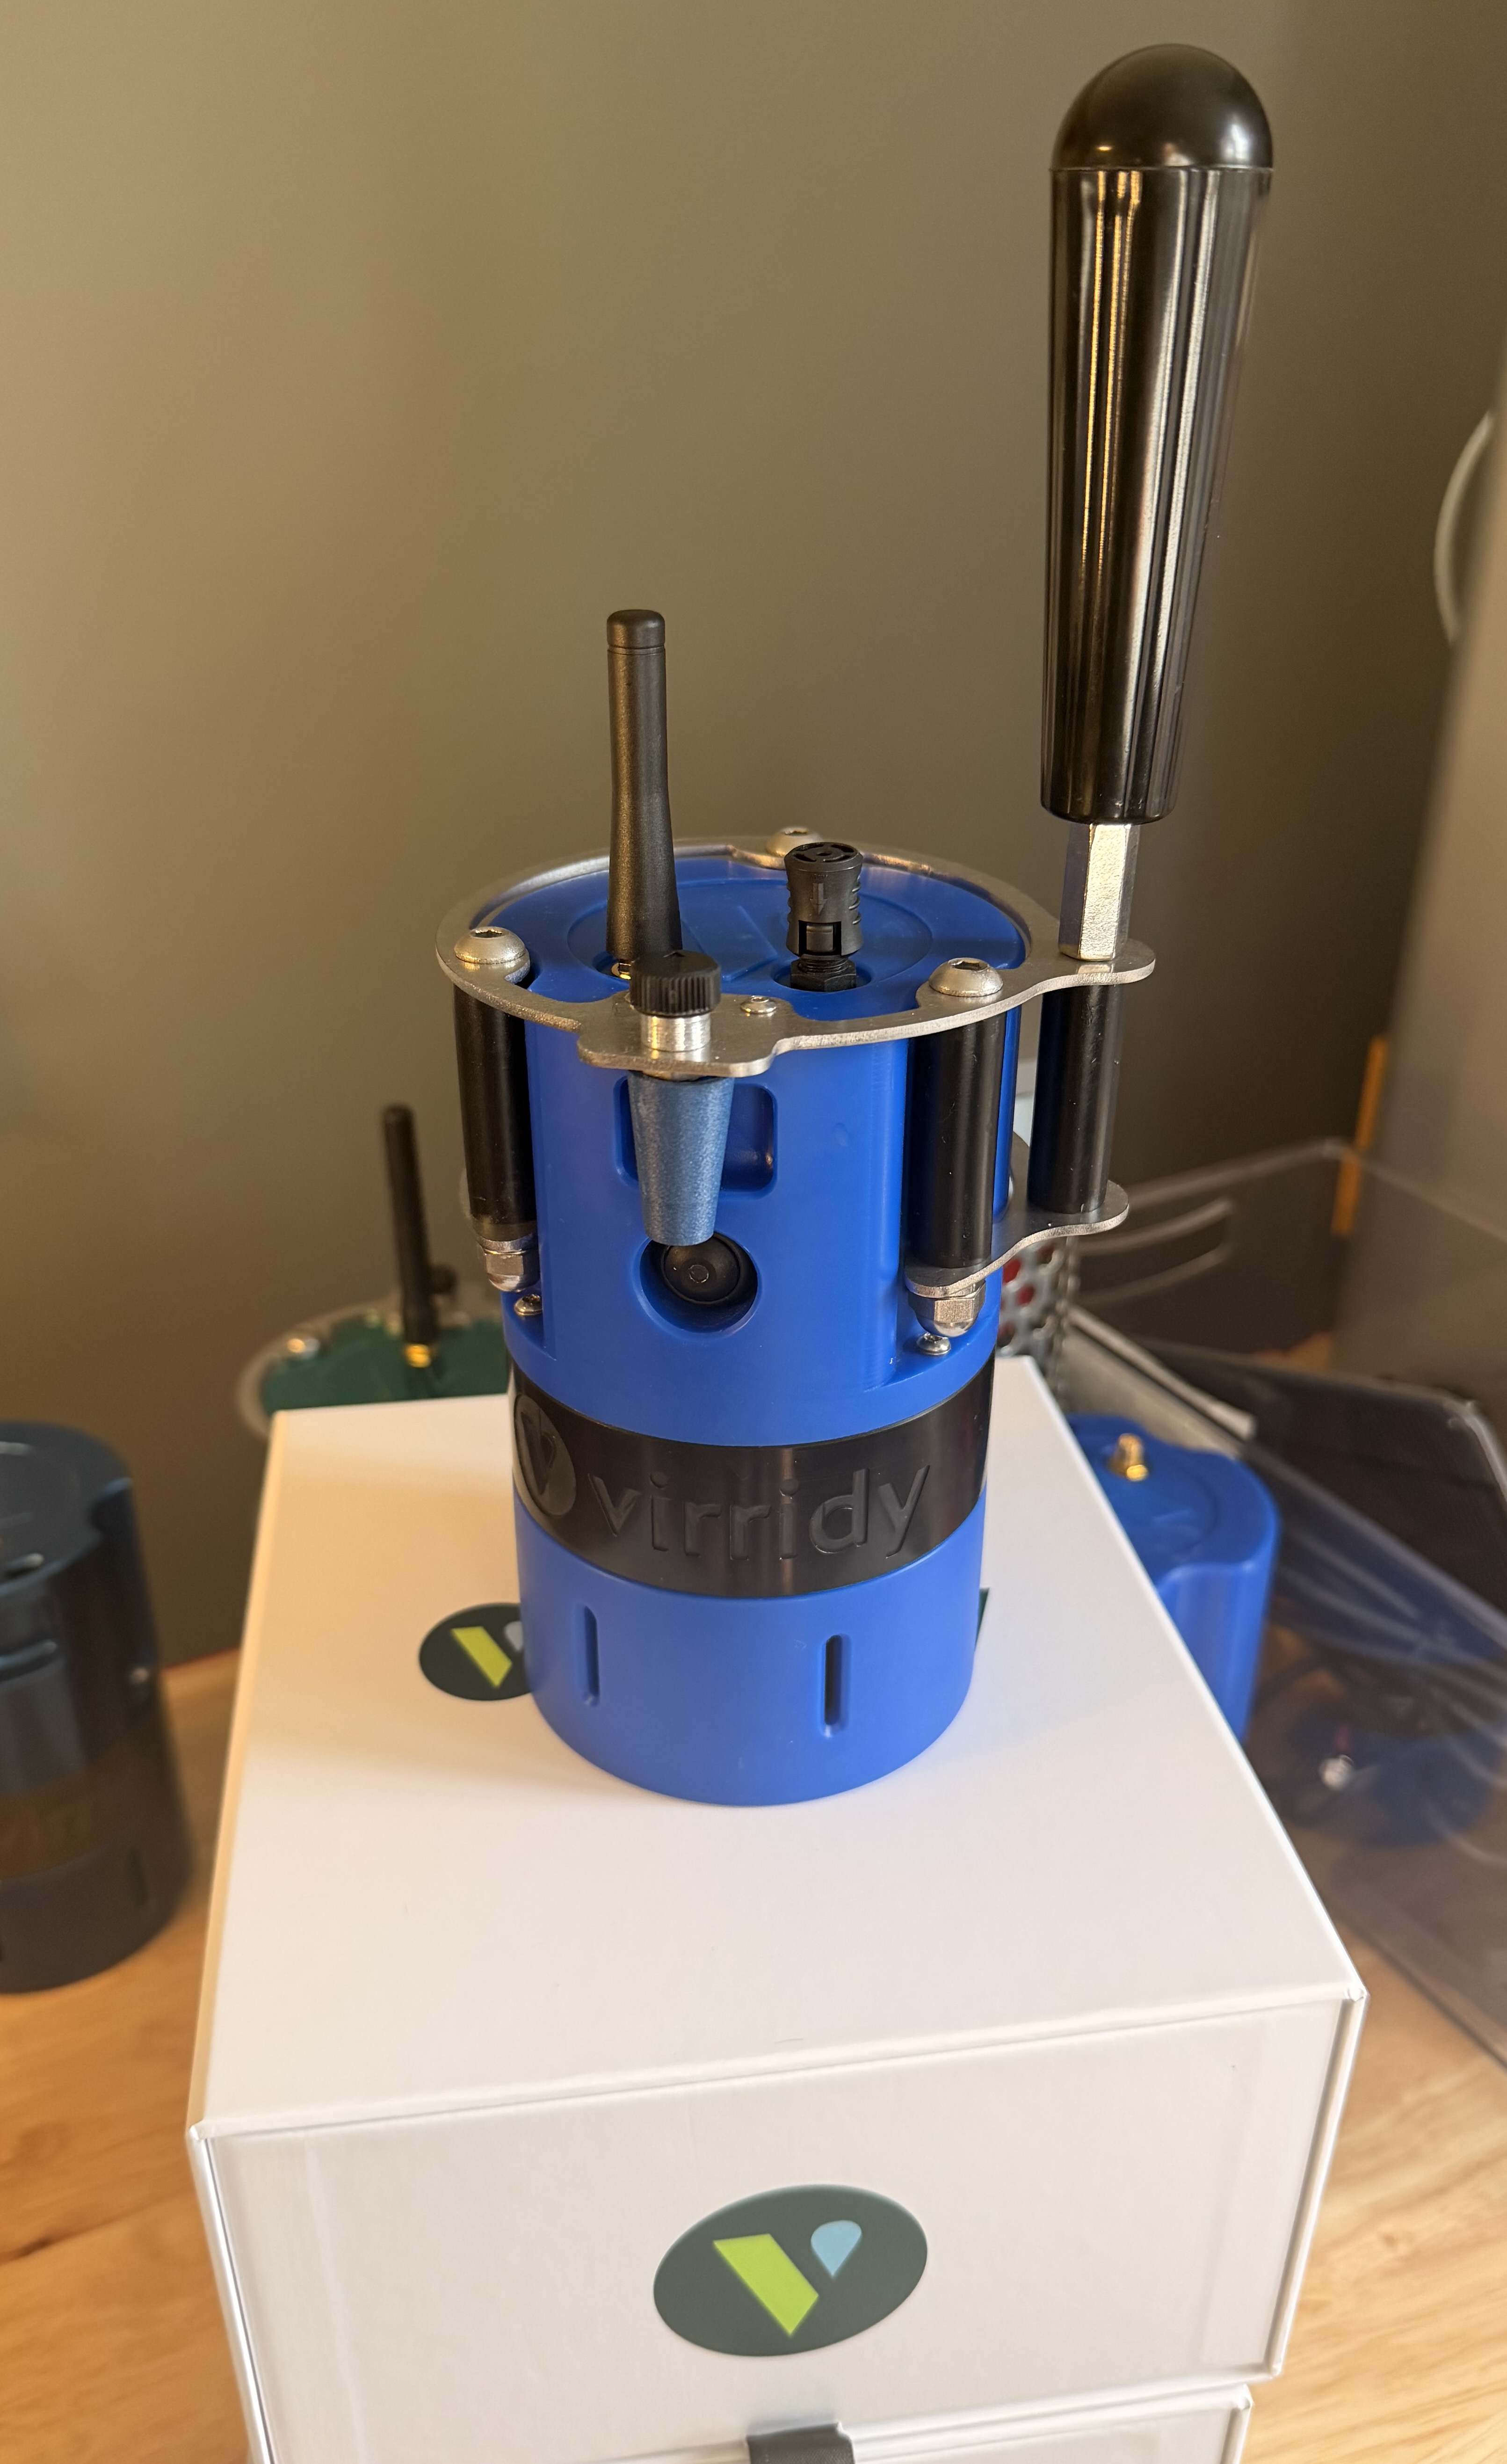
Handheld ConfigurationLume unit with stainless steel handle attachment, external whip antenna, and grab handle for spot-check sampling. The sensor window (bottom) is dipped into the water source for on-demand measurements.
Installing the Lume in a Protective Enclosure
The video below walks through securing the Lume inside its protective enclosure for open-water deployment—seating the sensor, fastening the cage, and attaching the suspension eye bolt for use in rivers, streams, or wells.
Step-by-Step Installation
1
Charge the Unit
Before first deployment, fully charge the Lume using the provided USB-C cable. A full charge takes approximately 4–6 hours. The battery voltage will read ~4.2V when fully charged on the dashboard.
2
Attach the Antenna
If using an external whip or wire-mount antenna, attach it to the antenna connector on the unit. Ensure the connection is finger-tight and the antenna is oriented vertically for best signal. If using the internal antenna, no action is needed.
3
Remove the Sensor Cover
Twist the protective cover counter-clockwise to remove it. Inspect the optical window—it should be clean and free of debris, fingerprints, or moisture. If needed, wipe gently with a lint-free cloth.
Important: The sensor cover must be re-installed before deployment. The cover should always be on when the sensor is running. It protects the optical window from debris and physical damage during operation.
4
Mount the Sensor
Secure the Lume to the mounting location using the provided bracket and hardware. Orient the sensor so that:
- The optical window faces the water (down or lateral, depending on mounting)
- The antenna has clear sky view (not submerged or blocked by metal)
- The unit is firmly secured and will not shift in high-flow conditions
5
Submerge the Sensor Window
Lower or position the unit so that the optical window is submerged below the water surface. Confirm at least 15 cm (6 in) of water above the window. The unit body above the window can be partially or fully submerged—the housing is waterproof.
6
Verify Data Transmission
Within 5–15 minutes of deployment (depending on reporting interval), check the Lume Dashboard to confirm data is being received. Look for your unit’s barcode ID and verify that TLF, temperature, and turbidity values are updating.
First readings: Allow 15–30 minutes of data collection before interpreting results. Initial readings may stabilize as the sensor equilibrates to water temperature.
7
Record Deployment Details
Document the following for each installation: barcode ID, GPS coordinates (captured automatically), deployment date/time, mounting description, water body name, and any nearby contamination sources or points of interest.
7. Power On & Configuration
The Lume begins sampling and transmitting automatically once powered. All configuration changes are made remotely through the cloud platform—no physical access to the unit is required.
Turning the Sensor On
Press and hold the power button for approximately 1 second, then release. The LED will illuminate to confirm the unit is on. The Lume will begin its startup sequence and start sampling automatically.
Turning the Sensor Off
Press and hold the power button for 10 seconds, then release. The LED will turn off to confirm the unit has powered down. If the LED remains on, repeat the process ensuring you hold for the full 10 seconds before releasing.
Configurable Parameters
| Parameter | Range | Default |
|---|---|---|
| Sampling interval | 30 seconds – 24 hours | 1 hour |
| Reporting interval | 5 minutes – several days | 24 hours |
| LED power | Adjustable | Factory default |
| SiPM bias voltage | Adjustable | Factory default |
Battery life tradeoff: Shorter sampling and reporting intervals consume more power. At the default settings (hourly sampling, 24-hour reporting), battery life is approximately 1 year. Increasing to 15-minute sampling with 1-hour reporting will reduce battery life to approximately 3–4 months.
Recommended Configurations
| Use Case | Sampling | Reporting | Est. Battery Life |
|---|---|---|---|
| Long-term baseline monitoring | 1 hour | 24 hours | ~12 months |
| Recreational water / beach monitoring | 15 minutes | 1 hour | ~3–4 months |
| CSO / event detection | 5 minutes | 15 minutes | ~1–2 months |
| Short-term intensive study | 30 seconds | 5 minutes | ~1–2 weeks |
Contact Virridy support to change configuration remotely, or access the configuration panel on the dashboard if you have admin permissions.
8. Dashboard & Data Access
All Lume data is transmitted to the secure Virridy cloud platform and accessible via the web dashboard at thelume.ai/dashboard.
Dashboard Features
- Real-time display: TLF (ppb), E. coli risk (%), temperature (°C), turbidity (kcps/SPAD), battery voltage (V)
- Device status: Online / Stale / Offline indicators with last-seen timestamps
- Interactive charts: Configurable time ranges and aggregation intervals
- CSV export: Download raw data for any date range and sensor
- Multi-sensor view: Monitor all deployed units from a single dashboard
- API access: Programmatic access for integration with existing data systems
Data Parameters
| Field | Unit | Description |
|---|---|---|
| mon2_val (TLF) | ppb | Tryptophan-like fluorescence reading |
| temperature | °C | Water temperature |
| signal_per_spad_kcps | kcps/SPAD | Turbidity (normalized signal intensity) |
| distance_mm | mm | Distance to water surface (TOF sensor) |
| voltage | V | Battery voltage level |
| barcode | — | Unit identifier |
| floor_min | ISO timestamp | Minute-level aggregated timestamp |
Programmatic Data API (Customer API)
Beyond the dashboard, every Lume deployment can be accessed programmatically through the Virridy Lume Customer API — a small, read-only HTTPS API that returns the same server-computed E. coli probability, estimated CFU concentration, turbidity, and water temperature the dashboard renders, as JSON you can ingest into your own systems (SCADA, data warehouses, public dashboards, alerting).
| Property | Value |
|---|---|
| Base URL | https://lume-inventory-api.evan-thomas-3d8.workers.dev |
| Format | JSON, UTF-8. Times are ISO-8601 UTC. |
| Auth header | Authorization: Bearer lume_sk_<your-token> |
| Scope | Each token authenticates as one organization and returns data only for that organization's deployed sensors. Out-of-scope barcodes return 404. |
Getting a token: Your Virridy contact issues an API token for your account — a 72-character string beginning lume_sk_ — and delivers it through a secure channel. Treat it like a password: anyone holding it can pull your sensor data. If a token is lost or shared by mistake, email info@virridy.com and we'll revoke it within minutes and issue a fresh one.
Endpoint 1 — Latest reading per sensor
GET/api/v1/customer/sensors
Returns the most recent server-computed prediction for every deployed sensor in your account.
curl https://lume-inventory-api.evan-thomas-3d8.workers.dev/api/v1/customer/sensors \
  -H "Authorization: Bearer lume_sk_..."
Example response
{
  "model_version": "2026-04-27-turbidity-relative",
  "customer": "Your Organization",
  "generated_at": "2026-06-03T14:00:00.000Z",
  "sensors": [
    {
      "barcode": "50001",
      "use_case": "Main St. Bridge",
      "last_seen": "2026-06-03T13:45:00.000Z",
      "ecoli_prob": 0.21,
      "ecoli_cfu": 18.4,
      "turbidity_ntu_rel": 6.2,
      "temp_c": 19.4,
      "tlf_mon2": 1320,
      "voltage_v": 12.6
    }
  ]
}
Endpoint 2 — Historical timeseries for one sensor
GET/api/v1/customer/sensors/<barcode>/timeseries
Returns a time-series of 15-minute-binned predictions for one sensor.
| Param | Default | Range | Meaning |
|---|---|---|---|
| hours | 24 | 1–168 | Window length in hours, ending at “now”. |
curl "https://lume-inventory-api.evan-thomas-3d8.workers.dev/api/v1/customer/sensors/50001/timeseries?hours=24" \
  -H "Authorization: Bearer lume_sk_..."
Example response
{
  "model_version": "2026-04-27-turbidity-relative",
  "customer": "Your Organization",
  "barcode": "50001",
  "hours": 24,
  "generated_at": "2026-06-03T14:00:00.000Z",
  "readings": [
    {
      "time": "2026-06-03T13:30:00.000Z",
      "ecoli_prob": 0.18,
      "ecoli_cfu": 15.1,
      "turbidity_ntu_rel": 5.9,
      "temp_c": 19.2,
      "tlf_mon2": 1280
    }
  ]
}
Readings are sorted ascending by time. Bins with no valid reading in that interval are absent, not null — the response is sparse. Requesting a barcode that isn't on your account returns 404.
Response fields
| Field | Meaning |
|---|---|
| model_version | The TLF→E. coli prediction model version. Changes when we retrain; changes are announced in advance. |
| customer | Your organization name on record. |
| generated_at | Server time the response was assembled. |
| barcode | Sensor barcode (string). |
| use_case | Free-text label for the deployment site, set by Virridy admins. |
| last_seen | Time of the most recent reading used in the prediction. null if the sensor hasn't reported recently. |
| ecoli_prob | Probability the E. coli concentration exceeds 10 CFU/100 mL, in [0, 1]. |
| ecoli_cfu | Estimated E. coli concentration in CFU/100 mL, floored at 0.1. |
| turbidity_ntu_rel | Sensor-relative turbidity (NTU). Not cross-comparable between sensors — see note below. |
| temp_c | Water temperature in °C. |
| tlf_mon2 | Raw tryptophan-like fluorescence signal (mon2 channel, arbitrary units). |
| voltage_v | Sensor battery voltage (V), when available. |
Sensors that haven't reported within the last 3 hours show null for prediction fields. We never extrapolate — apply your own staleness rules using last_seen.
Errors
| Status | Body | Meaning |
|---|---|---|
| 401 | {"error":"Unauthorized"} | Missing or invalid token, or the token was revoked. |
| 404 | {"error":"Barcode not found in your account"} | The barcode in the URL isn't a deployed sensor in your account. |
| 502 | {"error":"Upstream error: ..."} | Transient — the underlying sensor data pipeline returned an error. Retry. |
Model versioning
Every response carries a model_version identifier. When we retrain the regression (new coefficients, new turbidity calibration, etc.), this string changes. Significant model changes are announced in advance — log model_version alongside the readings you persist so future analyses know which model produced them.
About the turbidity field
turbidity_ntu_rel is sensor-relative: the slope of the bench-calibrated NTU regression is applied on top of each sensor's own clean-water baseline (10th-percentile in-water signal). It tracks relative turbidity changes for that specific sensor over time, but values are not directly comparable between sensors. A future model release will move to absolute NTU once enough multi-sensor formazin calibrations are in hand; the field name will not change.
Rate limits & cadence
No hard rate limits today. Reasonable polling cadences:
/api/v1/customer/sensors— once every 15 minutes, matching the sensor reporting cadence. Polling more often returns the same data./api/v1/customer/sensors/<barcode>/timeseries— once per hour or less; pull a 24-hour or 7-day window as needed.
Support
Email info@virridy.com with the model_version (or the request time if no response came back), the request URL (minus your token), the full response body, and a short note on what you expected versus what you got.
9. Operations & Maintenance
Maintenance Schedule
| Task | Frequency | Time | Notes |
|---|---|---|---|
| Visual inspection | Monthly | 5 min | Check mounting, debris, water level, antenna |
| Sensor window cleaning | Monthly (or as needed) | 5 min | Twist off cover, wipe window with lint-free cloth, replace cover |
| Battery check | Monthly (via dashboard) | 1 min | Check voltage on dashboard; recharge if below 3.4V |
| Battery recharge | Per configuration (see Section 7) | 4–6 hr | Remove unit, charge via USB-C, redeploy |
| Data review | Weekly or as needed | 10 min | Review dashboard for anomalies, gaps, or drift |
No calibration required. The Lume uses factory-calibrated optics with machine learning models that do not drift. If you observe unexpected readings, clean the sensor window first—biofouling is the most common cause of data anomalies.
Cleaning Procedure
1
Lift or remove the Lume from the water. No tools are needed.
2
Twist the sensor cover counter-clockwise and remove it.
3
Inspect the optical window for biofilm, sediment, or debris.
4
Wipe the window gently with a lint-free cloth or soft brush. For heavy biofouling, rinse with clean water or a dilute isopropyl alcohol solution (70%). Do not use abrasive materials.
5
Replace the sensor cover (twist clockwise until snug) and redeploy.
Do not: Use abrasive pads, scouring compounds, or acetone on the optical window. These can scratch the window and degrade measurement quality.
Battery Management
- Full charge voltage: ~4.2V
- Low battery warning: Below 3.4V on dashboard — plan a recharge visit
- Critical: Below 3.0V — unit may stop transmitting. Recharge immediately.
- Solar option: For continuous deployments, connect a solar panel to the USB-C port to eliminate battery recharge visits.
Seasonal Considerations
- Winter / freeze risk: If water may freeze around the sensor, retrieve the unit before freeze-up. The housing is waterproof but not rated for ice encasement.
- High turbidity events: Storm events may temporarily coat the sensor window. Check and clean after major storm events.
- Algal blooms: Heavy algal growth can foul the window faster than normal. Increase cleaning frequency during bloom season.
10. Troubleshooting
| Symptom | Likely Cause | Resolution |
|---|---|---|
| No data on dashboard | Low battery or no cellular signal | Check battery voltage; confirm cellular coverage at site; check antenna connection |
| Data gaps (intermittent) | Weak cellular signal | Reposition antenna; switch to external whip or wire-mount antenna; consider satellite option |
| TLF readings unusually high | Biofouling on optical window | Clean the sensor window (Section 9) |
| TLF readings flat / zero | Sensor window not submerged or obstructed | Verify water level covers the window; remove any debris blocking the optics |
| Turbidity reads very high | Sediment on TOF sensor window | Clean the sensor window |
| Battery draining faster than expected | Sampling/reporting interval too frequent | Adjust intervals via remote configuration (Section 7) |
| Unit shows “Stale” on dashboard | Missed last expected report | May be transient. If persists >2 reporting cycles, visit the site to check power and signal |
| Temperature reads air temp, not water | Water level has dropped below sensor | Reposition the unit to ensure submersion |
Support: For issues not resolved above, contact Virridy support at [email protected] with your unit barcode ID, a description of the issue, and a screenshot of the dashboard if possible.
11. Safety
- The Lume uses low-power UV LEDs (280 nm for TLF mode). Do not look directly at the optical window when the LED is active. Under normal operation, the LED fires only during measurement cycles (millisecond pulses) and poses no hazard.
- Follow all local safety protocols when working near water bodies, including use of personal flotation devices (PFDs) where required.
- The Lume contains a lithium battery. Do not puncture, crush, incinerate, or expose to temperatures above 60°C (140°F).
- Dispose of the unit in accordance with local electronics recycling regulations. Do not dispose in household waste.
Water safety: Always follow site-specific water safety protocols. Use the buddy system when deploying or servicing sensors in or near water. Never enter water bodies alone.
12. Lume Desktop App
The Lume Desktop App is a macOS application for direct USB serial connection to a Lume sensor. It provides real-time sensor data visualization, E. coli predictions, CSV data import/export, and an on-device model calibration workflow—all without requiring an internet connection.
When to use the Desktop App: Use it for field calibration sessions, offline data review, or any time you want to connect directly to a sensor over USB rather than waiting for cloud reporting intervals.
Download
Two builds are available for Windows PC and macOS—download the one that matches your operating system:
| Platform | Description | Download |
|---|---|---|
| Windows PC | Windows 11, statically linked. Recommended for routine field use. | lume-dashboard-win.zip |
| macOS | macOS binary with the most recent features and calibration updates. | lume-dashboard-mac.zip |
First Launch — Windows PC
Why does Windows warn me? The app is not commercially code-signed. Windows SmartScreen flags any unsigned executable the first time it runs. This is a one-time prompt — subsequent launches open normally.
1
Unzip the download
Right-click lume-dashboard-win.zip and choose Extract All. Open the extracted folder.
2
Bypass the SmartScreen warning
Double-click lume-dashboard.exe. If a blue SmartScreen dialog appears saying "Windows protected your PC":
- Click More info (bottom-left of the dialog).
- Click Run anyway.
The app will open. You will not see this prompt again for this file.
First Launch — macOS
Why does macOS warn me? The app is not notarized with an Apple Developer certificate. macOS Gatekeeper blocks unnotarized binaries by default. The steps below tell Gatekeeper to trust this specific file — you only do this once.
1
Unzip the download
Double-click lume-dashboard-mac.zip in Finder. macOS extracts lume-dashboard-mac with execute permissions already set — no Terminal required.
2
Open via right-click
Do not double-click the file. Instead, right-click (or Control-click) lume-dashboard-mac in Finder and choose Open. A dialog will ask if you are sure — click Open. The app will launch.
3
If the right-click method doesn't work (macOS Sequoia)
On macOS 15 Sequoia, the right-click dialog may not offer an Open button. Use this fallback:
- Try to double-click
lume-dashboard-mac— macOS will block it and show an alert. - Open System Settings → Privacy & Security.
- Scroll to the bottom of the Privacy & Security page. You will see a message: "lume-dashboard-mac was blocked from use because it is not from an identified developer."
- Click Open Anyway.
- Enter your Mac password if prompted, then click Open Anyway again.
After this, the app opens normally every time.
Connecting to a Sensor
1
Connect via USB
Plug the Lume sensor into your Mac using a USB-C cable. The sensor does not need to be in the water—you can connect it on a bench.
2
Choose a data source
Click the Device Status indicator in the top-right corner of the app. The Choose Data Source dialog will open. Select the serial port that corresponds to your Lume sensor (typically listed as a USB serial device) and click Connect.
3
Verify live data
Once connected, the Device Status indicator will change to Serial and the current readings (temperature, fluorescence, turbidity) will appear in the header row. Time-series graphs on the Sensor Data tab will begin populating within the first sampling cycle.
App Tabs
Sensor Data
Displays rolling time-series graphs for:
- Tryptophan-Like Fluorescence (TLF) — raw ADC value
- Turbidity (Time-of-Flight) — ambient per SPAD (kcps)
- Water Temperature — °C
E. coli Predictions
Shows the model-derived E. coli estimate with a 90% confidence interval, a time-series category graph (Low / Medium / High), and the probability breakdown across the three regulatory threshold categories (<10, 10–100, >100 CFU/100 mL).
Model & Calibration
Contains two panels:
- Calibration Samples — capture sensor snapshots while the device is running, enter paired Colilert MPN values, and fit a new log-linear OLS model directly in the app.
- Model Coefficients — view and edit the five regression coefficients (β₀–β₄) used to compute E. coli predictions, and save them to the local preferences file.
Importing & Exporting CSV Data
| Button | Action |
|---|---|
| ↑ Upload CSV | Load a previously saved CSV file into the app. All graphs and predictions will update to reflect the loaded data. Supports both the current consolidated format and legacy multi-row formats. |
| ↓ Download CSV | Save the current session data to a CSV file. Each row in the output corresponds to one sensor observation and includes all raw readings and model prediction values. |
CSV format: Each row contains: timestamp, hdc2080_temp_c, tlf_raw, turb_raw, led_raw, sipm_bias_raw, sipm_mon2_raw, model_temp_c, model_tof_raw, model_pred, model_pred_ci_low, model_pred_ci_high. Downloaded CSVs can be re-uploaded without data loss.
Calibration Workflow
1
Capture samples
While the sensor is connected and running, navigate to the Model & Calibration tab and click Capture Sample at the moment you collect a water grab sample for Colilert analysis. The app records the current TLF, turbidity, and temperature values with a timestamp.
2
Enter Colilert MPN results
Once you have laboratory MPN results, return to the app and enter each value in the Colilert MPN column next to the corresponding captured sample. You can enter 0 if the result was below detection. Press Enter to confirm each value.
3
Fit the model
Once you have at least 3 complete samples (sensor readings + MPN values), the Fit Model section will appear. Click Fit Model to run an OLS regression on ln(CFU). The app displays R², RMSE (log scale), and the new coefficients alongside the current ones.
4
Apply or discard
Click Apply Model to replace the current coefficients with the new fit. The E. coli predictions will update immediately for all historical data in the current session. Click Discard to keep the existing coefficients.
Saving coefficients: After applying a new model, click Save in the Model Coefficients panel to persist the values to disk. They will be loaded automatically on the next app launch.